Progress Monitoring
Intervention often requires consistent implementation over a period of time (e.g. for reading, the average intervention time is about 2 years) to reach a goal. Some areas lend themselves better than others to statistically measuring progress; therefore, a variety of sources may be used for collecting data. Charting a child’s progress toward the goal can be helpful for determining rate of progress and if adjustments need to be made. For instance, if a child’s reading level is below grade level, his/her rate of learning needs to move faster than normal in order to eventually catch up. See the example below:
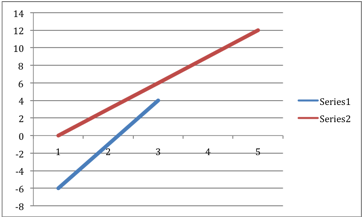
On the graph above, the red line represents the target goal to reach and the blue line represents the child’s progress toward that goal. For example, at Test Session 1, we expect the child to demonstrate sight-word recognition skills that are on grade level (horizontal axis = 0). If the goal is to have skills on grade level, then the red line would be a horizontal line; however, this graph is depicting a goal to have skills that are one year above grade level by the end of a two-year intervention. Testing on this child is being completed every 6 months (Point 1 was the initial testing, Point 2 was 6 months later, and so forth). At Point 1, the child’s level was 6 months below grade level; at Point 2, skills were 1 month below; at Point 3 skills were 4 months above grade level.